
CH4 a more potent greenhouse gas than CO2
There is now a widespread scientific consensus on the profound influence of human activity on the global climatic system, particularly through increased emissions of greenhouse gases like CO2 and CH4 since the pre-industrial era.
Although CH4 is roughly 200 times less abundant in the atmosphere than CO2, it is a more potent greenhouse gas than CO2. The comparative impact of CH4 on climate change is more than 86 times greater than CO2 over a 20-year period (IPCC, 2013).
However, due to its relatively short lifetime of ~9 years, it is now recognized that one of the most efficient methods to mitigate warming due to greenhouse gases on decadal time frames is to cut CH4 emissions (Shindell et al., 2012).
Natural and anthropogenic CH4 sources
Atmospheric CH4 concentrations have more than doubled since the pre-industrial period, reaching a new high of 1889 ± 2 ppb in 2020, as shown by the latest analysis of observations from the WMO Global Atmosphere Watch (GAW) Programme (WMO News Bulletin, 2021). This odourless, transparent gas is released into the atmosphere by a wide variety of both natural and anthropogenic processes, see Figure 1.
- 40% of the emitted CH4 is of natural origin (wetlands, freshwaters, wildfires, termites, geological sources..).
- 60% comes from anthropogenic sources, such as waste management, fossil fuel exploitation, ruminants and rice agriculture.
Removal of CH4 is primarily due to oxidation by OH, resulting in an atmospheric lifetime of CH4 of ~9 years.
Although its main sources and sinks have been identified, there remain many uncertainties regarding the balance between those sources and sinks as we can see from Figure 1 (Kirschke et al., 2013). In addition, CH4 is a challenging atmospheric component to study as its non-monotonous changes in the last decades and its interannual variability remain not fully understood (Nisbet et al., 2014).
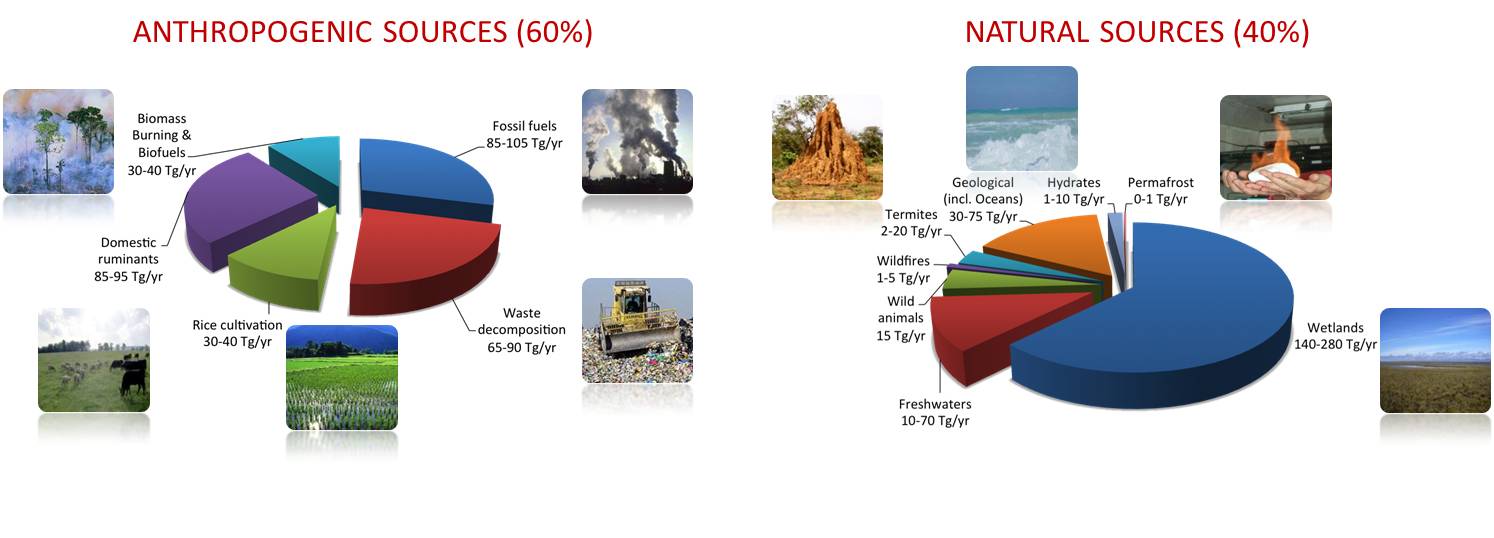
Figure 1 : Anthropogenic and natural sources of CH4. Figures taken from the Global carbon project. Figure from the Global Carbon Project; based on Kirschke et al., 2013.
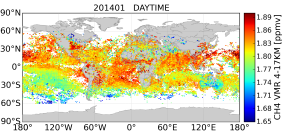
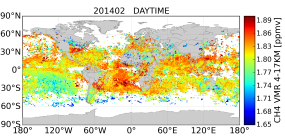
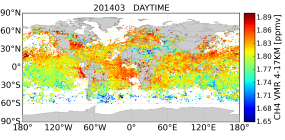
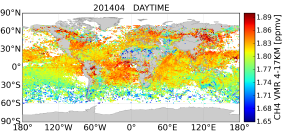
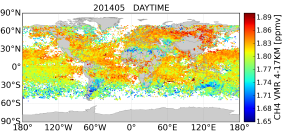
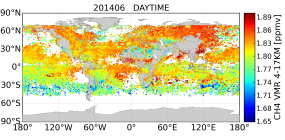
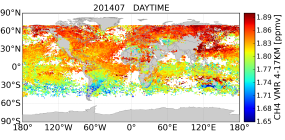
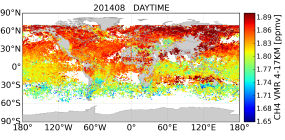
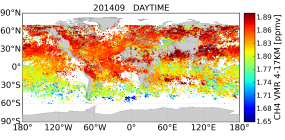
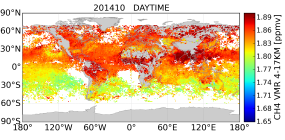
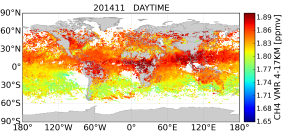
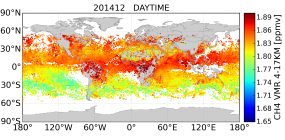
Figure 2 : Monthly mean maps of the BIRA-IASB IASI tropospheric CH4 column between 4 and 17 km for the year 2014.
Methane data
IASI CH4 data products (profiles, download files)
Validation
References
- IPCC, 2013: Climate Change 2013: The Physical Science Basis. Contribution of Working Group I to the Fifth Assessment Report of the Intergovernmental Panel on Climate Change [Stocker, T.F., D. Qin, G.-K. Plattner, M. Tignor, S.K. Allen, J. Boschung, A. Nauels, Y. Cia, V. Bex and P.M. Midgley (eds.)]. Cambridge University Press, Cambridge, United Kingdom and New York, NY, USA, 1535 pp.
- Kirschke et al. (2013), Three decades of global methane sources and sinks, Nature Geoscience, doi:10.1038/ngeo1955.
- Nisbet, E. G., Dlugokencky, E. J. and Bousquet, P.: Methane on the rise-again., Science, 343(6170), 493–5, doi:10.1126/science.1247828, 2014.
- WMO News Bulletin (2021)


